Read Test Results
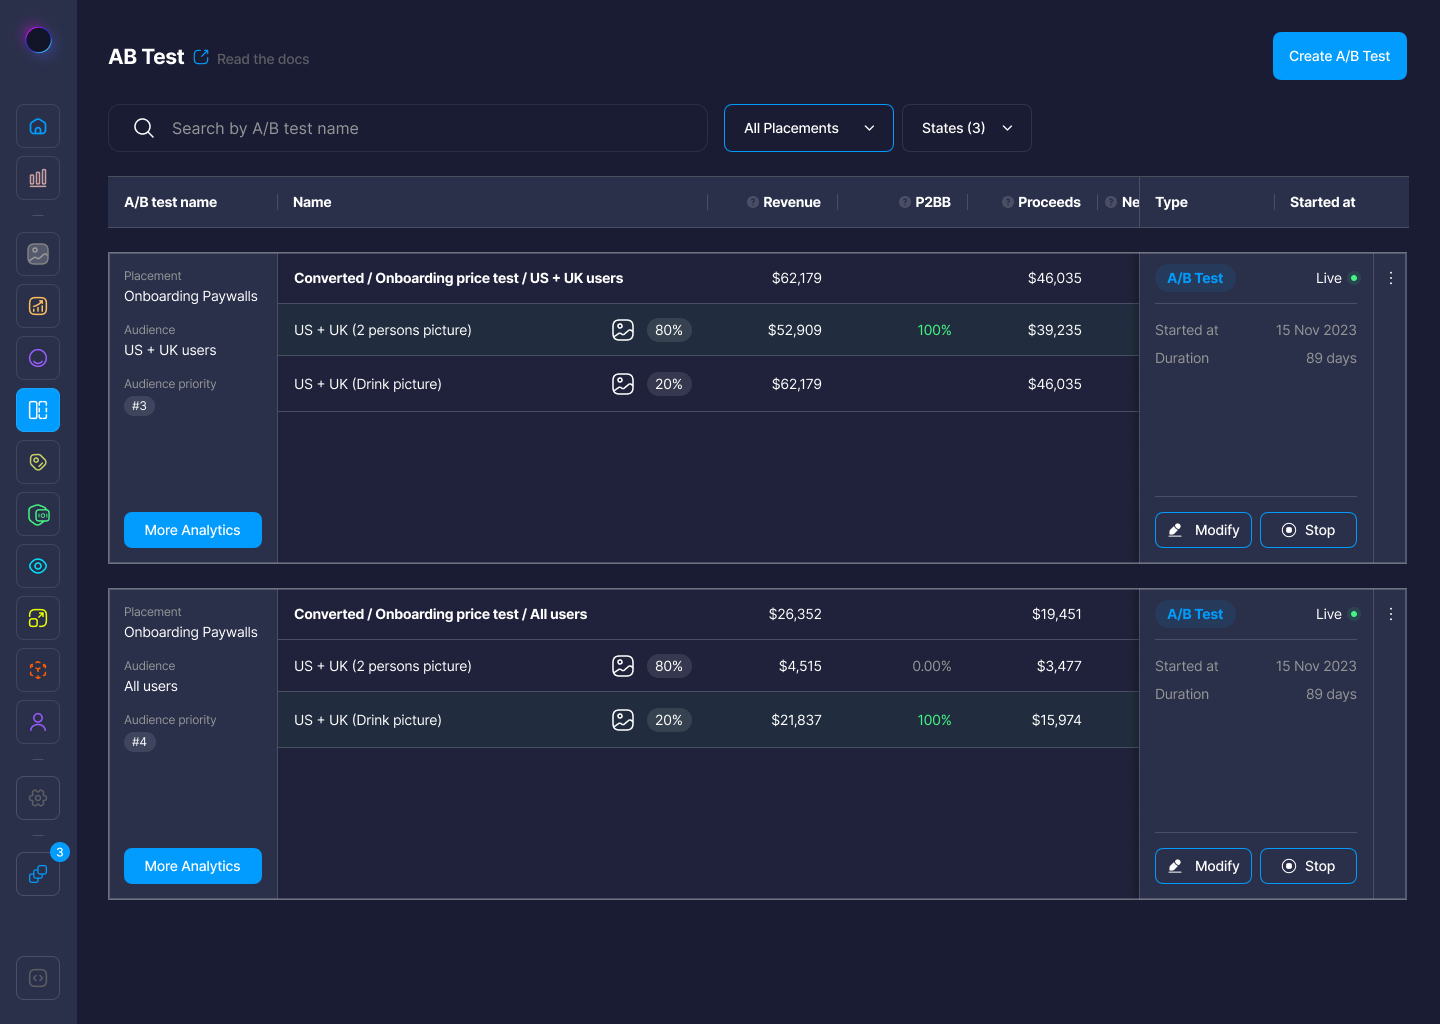
After running an A/B test in Botsi, you can stop it to end data collection and review how each paywall performed. The results screen gives you a quick summary, and you can click the More Analytics button to dive deeper into detailed performance metrics.

Analyze A/B Test Results
Botsi's test results can fall into three main categories: revenue, conversions, and engagement. This helps you quickly spot trends and make confident decisions about which paywall to keep or optimize further.
Revenue Insights
Use these metrics to understand the financial impact of each paywall:
- Revenue: Total gross revenue generated from the paywall.
- Proceeds: Earnings after subtracting store or platform fees.
- Net Proceeds: Final revenue after all deductions including taxes and processing fees.
- ARPPU (Average Revenue Per Paying User): Revenue divided by the number of users who made a purchase.
- ARPAS (Average Revenue Per Active Subscriber): Revenue divided by the number of current paying subscribers.
- Refunds: Number of purchases that were refunded.
- Refund Rate: Percentage of purchases that were refunded.
Conversion Metrics
These numbers reflect how effective the paywall was at converting users:
- CR Purchases: Conversion rate for purchases, calculated from users who viewed the paywall.
- CR Trials: Conversion rate from views to trial starts.
- Purchases: Total number of purchases made through the paywall.
- Trials: Total number of users who started a free trial.
- Trials Cancelled: Number of trial users who canceled before converting to a paid plan.
- P2BB: Pay-to-browse-buyer ratio; indicates the percentage of users who saw the paywall and made a purchase.
- Unique CR Purchases: Number of distinct users who viewed the paywall and made a purchase.
- Unique CR Trials: Number of distinct users who viewed the paywall and started a trial.
Engagement Metrics
Understand how users interacted with your paywall:
- Views: Total number of times the paywall was shown.
- Unique Views: Number of individual users who viewed the paywall.
- Unique Subscribers: Count of distinct users who became subscribers (trial or paid).
- Unique Paid Subscribers: Count of distinct users who became paying subscribers.
.png)
Use these metrics to evaluate:
- Which paywall generated the highest revenue.
- Which one had a higher conversion rate.
- Whether one variant significantly outperformed the other in any key metric.
This data will help you make informed decisions about which paywall to keep showing or which elements to reuse in future experiments.
Related Articles
For more information, consult the following pages: