Charts
Botsi Charts are powered by real-time data, ensuring that you always have access to the most up-to-date metrics. With advanced controls, you can filter and group your data based on various criteria, such as country, paywall, and product, offering greater flexibility and deeper insights.
Metrics
Botsi provides key metrics for tracking your app’s subscription and in-app revenue performance, giving you insights into both recurring and one-time income, user trials, and potential issues that could affect revenue. Here are the options:
Subscriptions & In-app
Revenue
MRR
ARR
ARPU
ARPPU
Installs
Active Subscriptions
Net Subscriptions
New Subscriptions
Subscription Renewal Cancelled
Expired Subscriptions
Non-subscriptions
Trials
Issues
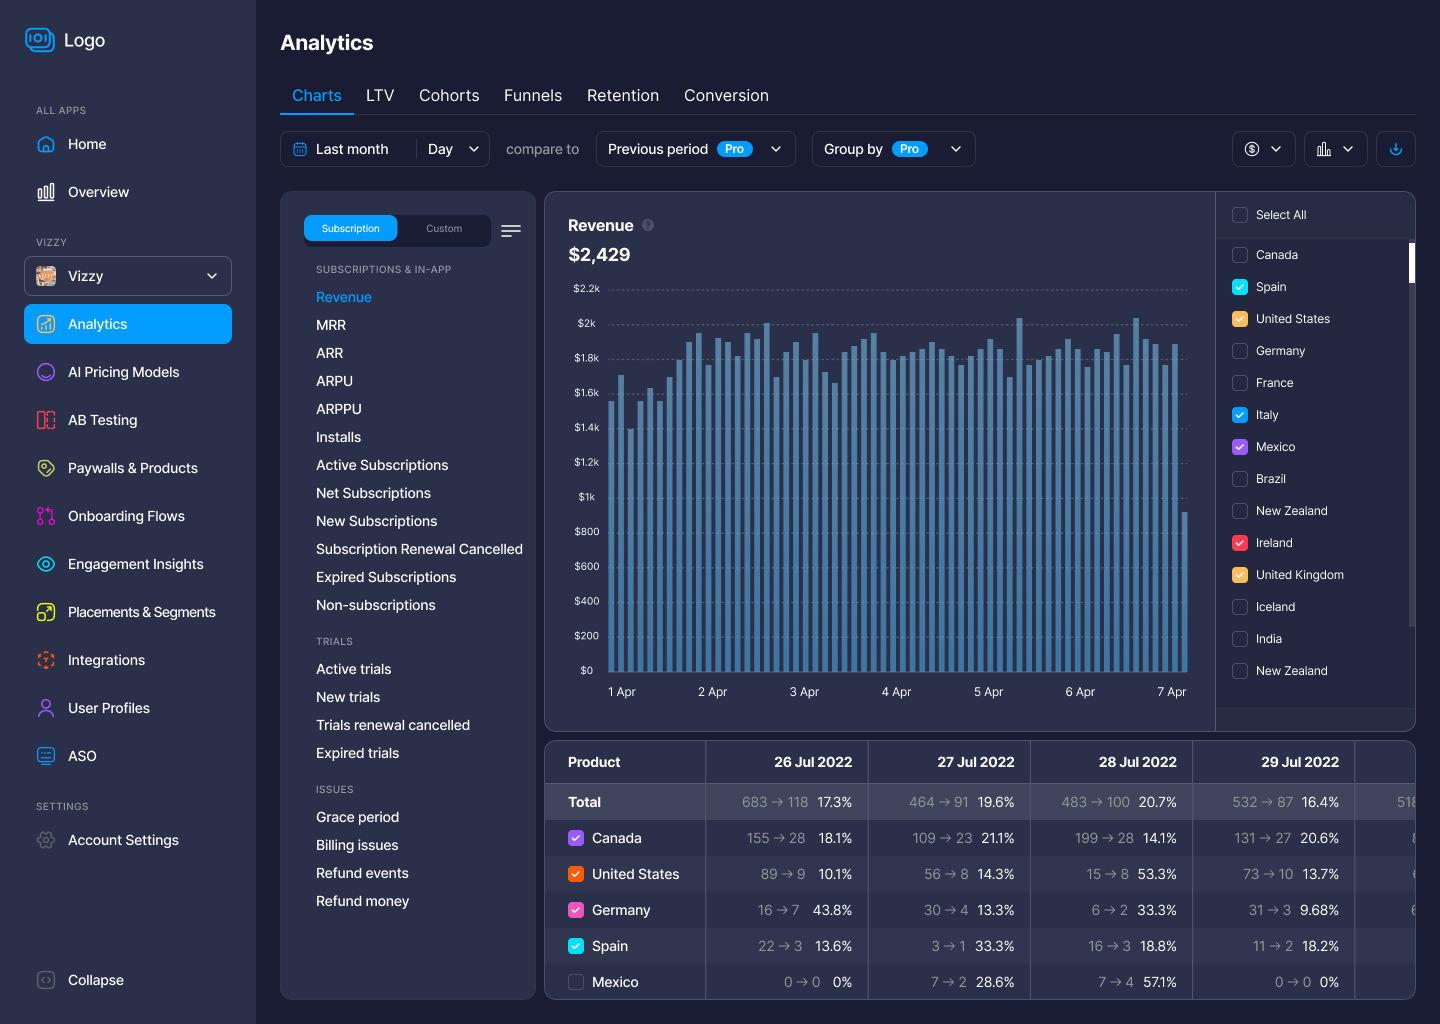
Filters
The Revenue Chart provides a range of filtering options to help you analyze your revenue data more effectively. Here are the key filters available:
- Period: You can select the time period for the data, such as the "Last month" or any custom date range.
- Day/Week/Month: The data can be grouped by day, week, or month to suit your reporting needs.
- Comparison Period: You can compare the current period with the previous period to track growth or identify trends.
- Countries: You can filter the data by different countries to see the revenue performance in specific regions. Available countries include Canada, Spain, the United States, Germany, France, Italy, Mexico, Brazil, New Zealand, and more.
- Products: Filter by product categories, which could be subscriptions or one-time purchases.
- Renewal Status: You can also filter based on subscription renewal status, showing data for new, expired, or renewed subscriptions.
Group By
The Group By functionality in the Revenue chart allows you to segment and organize your revenue data according to various attributes. This enables you to gain deeper insights into your financial performance, identify trends, and optimize strategies. Below are the available Group By options:
| Attribute | Description |
|---|---|
| Period | Group data by specific time periods, such as days, weeks, or months. Useful for analyzing revenue over time. |
| Renewal | Group by subscription renewal status, differentiating between new and renewed subscriptions. |
| Product | Group by product type (e.g., subscription plans, one-time purchases) to understand how different offerings are performing. |
| Country | Group by country to analyze how revenue varies by region. |
| Store | Group by store (e.g., App Store, Google Play) to compare performance across platforms. |
| Paywall | Group by different paywalls to assess the effectiveness of different pricing strategies or offers. |
| Audience | Group by audience type (e.g., new users, returning users) to evaluate revenue generated from different customer segments. |
| Placement | Group by where the app or product was placed (e.g., marketing channels, app stores) to track revenue generated from different placements. |
| Duration | Group by subscription duration (e.g., monthly, yearly) to analyze the impact of subscription lengths on revenue generation. |
| Offer Type | Group by offer type (e.g., promotional offers, discounted plans) to measure how different offers impact revenue. |
| Offer Discount Type | Group by discount type (e.g., percentage off, fixed amount) to assess the revenue generated from different discounting strategies. |
| Offer ID | Group by specific offer IDs to track the performance of individual campaigns or promotions. |
| Attribution | Group by attribution models, such as the source, campaign, or ad set, to identify which marketing strategies and channels drive the most revenue. |
| Reported by | Group by the source or team reporting the data, which can be useful in larger teams with multiple stakeholders. |
| Status | Group by subscription status (e.g., active, expired, cancelled) to monitor the status of subscriptions and identify opportunities for renewals. |
| Channel | Group by acquisition channel (e.g., organic, paid) to analyze how different marketing channels contribute to revenue. |
| Campaign | Group by marketing campaign to see which campaigns generate the most revenue and determine the effectiveness of different advertising efforts. |
| Ad Group | Group by ad group to track the performance of specific ad groups within larger campaigns. |
| Ad Set | Group by ad set to monitor the effectiveness of different ad sets within campaigns. |
| Creative (Keyword) | Group by creative or keyword used in advertisements to evaluate how specific creatives or keywords impact revenue generation. |
App Earning
You can also view your app's earnings in multiple ways. You can choose from the following breakdown options to understand your revenue from different perspectives:
- Gross Revenue: Displays total revenue before any deductions, including store commissions or taxes.
- Proceed After Store Commissions: Shows revenue after store commission fees, but before taxes.
- Proceed After Store Commissions and Taxes: Displays revenue after both store commissions and taxes have been deducted, representing the final amount received.
Chart Types
There are several chart types you can use to visualize your data. These options allow you to represent your revenue in various formats depending on your needs:
- Stacked Column: Displays revenue data in columns, stacking different data points on top of each other for easy comparison.
- Stacked Area: Uses areas stacked on top of each other to show the cumulative revenue data over time.
- Line: A line chart that shows the trend of revenue over time, useful for identifying patterns and changes.
- 100% Stacked Column: Similar to the stacked column chart but normalizes the data to show percentage values, making it easy to compare relative contributions.
- 100% Stacked Area: Similar to the stacked area chart but displays data as percentages of the total, useful for visualizing the relative share of different segments.
- Pie Chart: A circular chart that shows revenue data as segments, representing each segment's share of the total revenue.