Cohort Analysis
Cohort Analysis is a powerful asset for understanding how different groups of users behave over time. By grouping users based on shared characteristics, such as their sign-up date, subscription plan, or acquisition channel, you can track their behavior, engagement, and revenue contribution more effectively. This helps you gain insights into user retention, lifetime value, and the effectiveness of your marketing campaigns.
Cohort Analysis chart helps you to:
- Identify Patterns in User Behavior: By grouping users with similar characteristics, you can track how their behavior evolves over time, revealing insights into user retention and engagement.
- Evaluate Marketing Effectiveness: Track how users from different acquisition channels perform over time, helping you identify which channels bring in high-value users.
- Optimize Product and Retention Strategies: By analyzing cohorts, you can pinpoint which features or strategies work best for different user segments, helping you improve user retention and conversion rates.
How Cohort Analysis Works
Cohort analysis works by grouping users based on specific characteristics or behaviors that are relevant to your app. Some common cohort types include:
- Sign-up Cohorts: Users grouped by the month or week they signed up for your app.
- Acquisition Channel Cohorts: Users grouped based on where they were acquired (e.g., organic, paid ads, referrals).
- Subscription Plan Cohorts: Users grouped by their chosen subscription plan, such as basic, premium, or trial.
Each cohort is tracked over a specified period, allowing you to observe how they behave and how long they stay active.
Typical Cohort
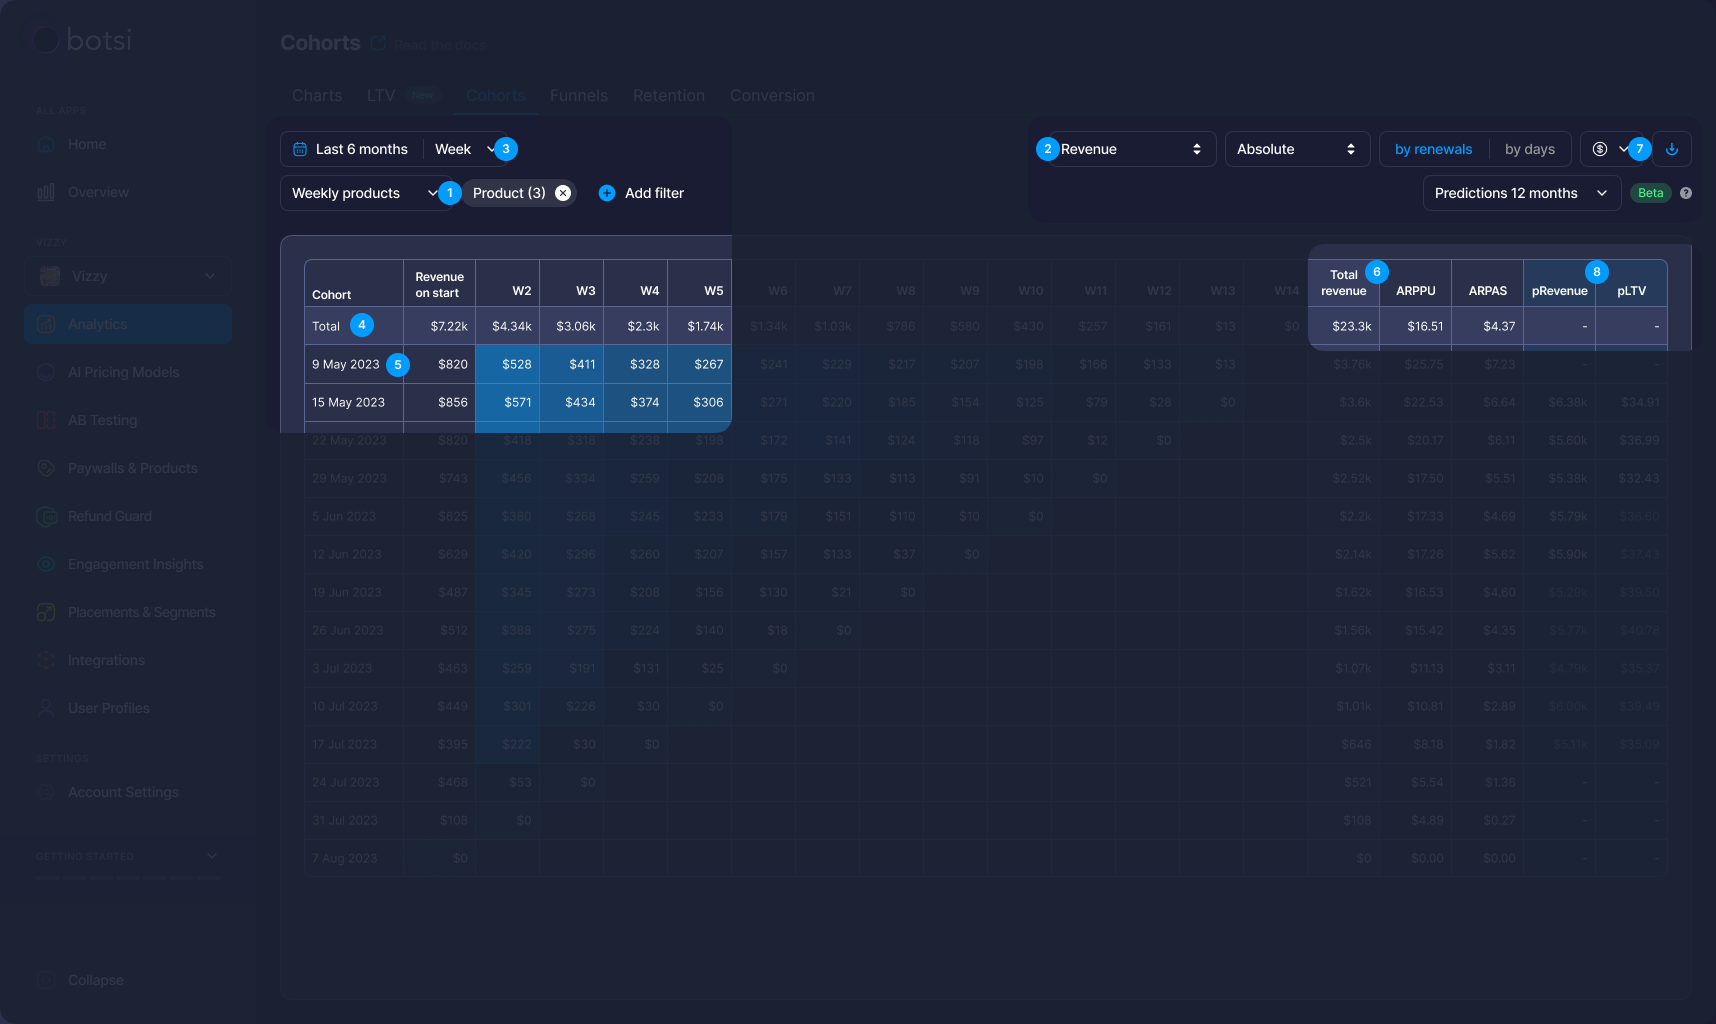
- Weekly products: The data is presented for weekly products, focusing on how weekly subscription products perform over time.
- Revenue type: The revenue is shown as absolute values, meaning the total revenue generated by each cohort is presented as raw monetary amounts.
- Time period & cohort segments: The data is for the last 3 months, with cohorts divided by weekly intervals, representing each week’s performance.
- Total row: The Total row aggregates the revenue across all cohorts for the period, providing a cumulative view of the data and the total number of users who installed the app during the entire period.
- Cohort breakdown: Each row, like the 9 May 2023 cohort, displays the revenue for the first period (subscription activation) and subsequent weeks, showing how revenue evolves over time.
- Metrics: The table includes ARPU (Average Revenue Per User), ARPPU (Average Revenue Per Paying User), and other performance metrics calculated for each cohort.
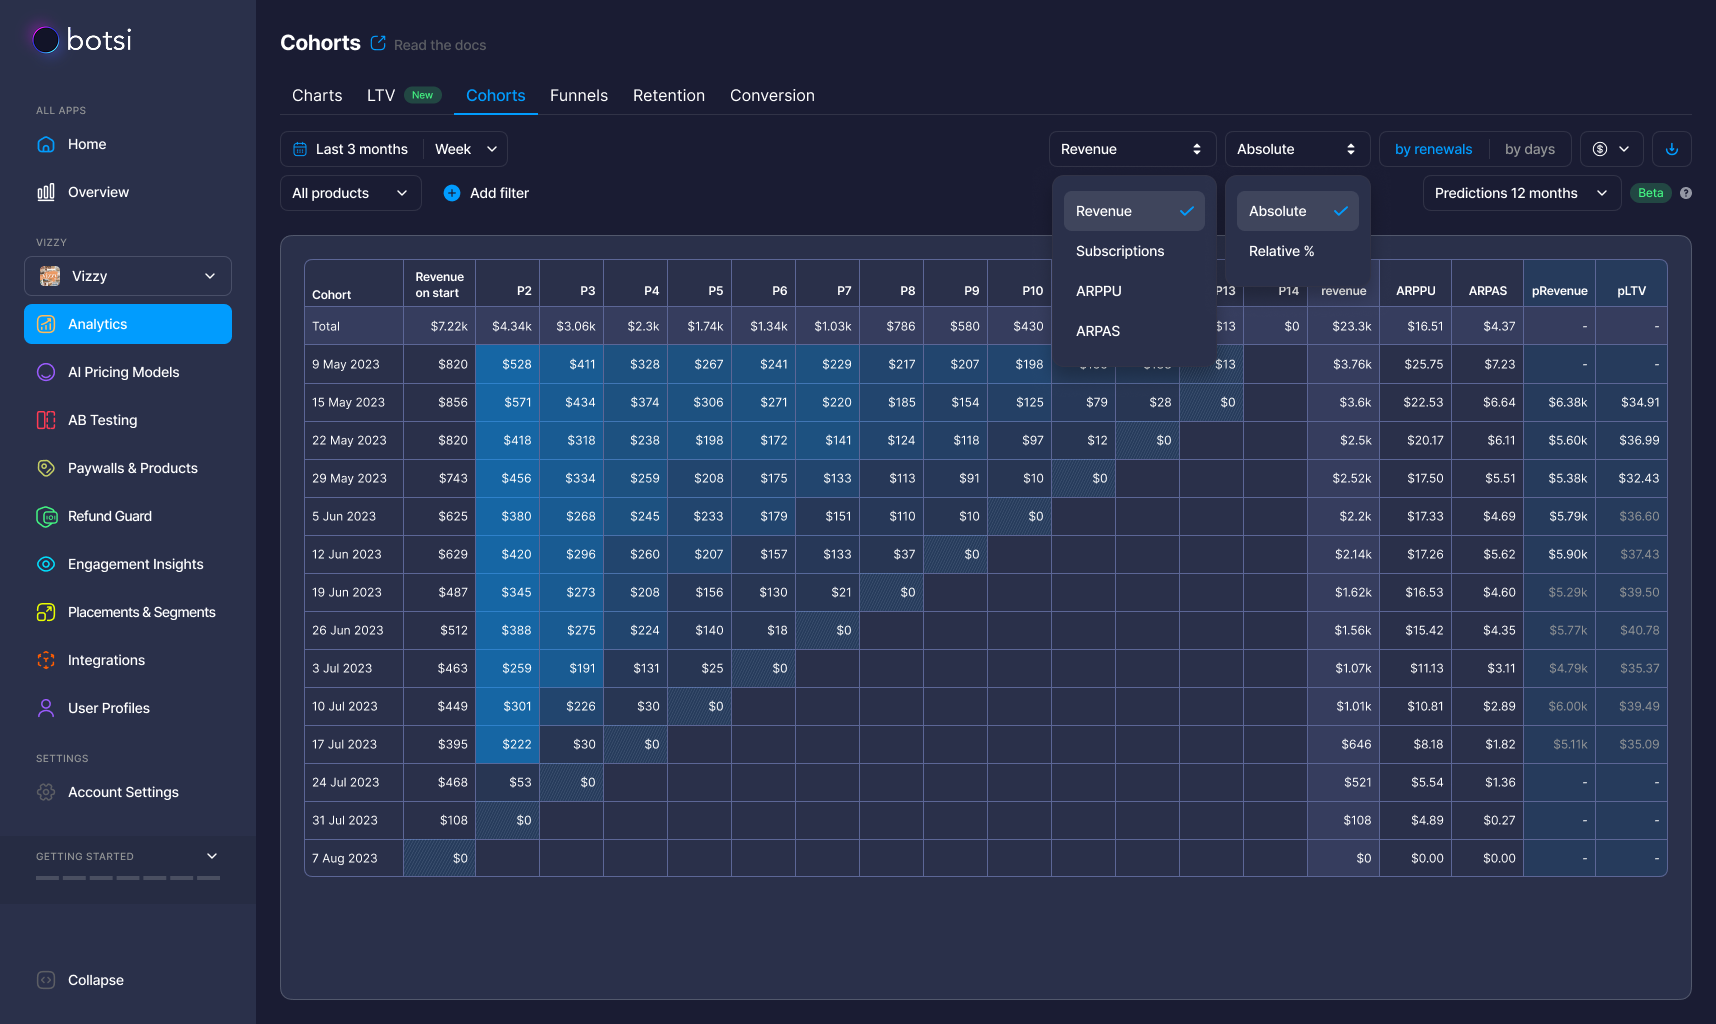
- Columns dropdown: The Columns dropdown allows customization of the data shown, such as viewing data for specific metrics like subscriptions, ARPPU, or predicted revenue.
- Predicted data: Predicted Revenue and Predicted LTV (Lifetime Value) are shown, offering forecasts of total revenue and the anticipated value of each cohort based on trends in the data.
Usage
In the Cohorts tab of the Analytics section, you can apply various filters, group data, and view metrics in different ways to gain deeper insights into user behavior. Here’s an overview of the options available:
Filters
- All Products: You can filter the data to include all products or select specific products for a more targeted analysis.
- Add Filter: This option allows you to apply additional filters, such as by subscription plan or user type, to refine the cohort data.
Group By
- By Renewals: You can group data by renewals to track how cohorts perform in terms of subscription renewals.
- By Days: This option groups the data by days, allowing you to analyze cohort performance over daily intervals.
Metrics
- Revenue: Track the absolute revenue generated by each cohort.
- Subscriptions: View the total number of subscriptions within each cohort.
- ARPPU (Average Revenue Per Paying User): Measures the average revenue generated per paying user within each cohort.
- ARPS (Average Revenue Per Subscriber): Shows the average revenue generated per subscriber within each cohort.
Other Options
- Absolute: Displays the raw numbers of revenue, subscriptions, etc., for each cohort.
- Relative %: Shows the relative percentage of revenue or subscriptions, helping to compare the performance of different cohorts in relation to one another.
- Predictions: Provides forecasts for future cohort performance based on historical data.