Retention
Understanding how your app retains clients over time is crucial for long-term success. Retention charts provide insights into the effectiveness of your user engagement strategies and highlight areas where you can improve conversions and overall revenue.
By analyzing retention data, you can uncover key trends and patterns in user behavior, enabling you to:
Track user loyalty
Understand how your users engage with your app across different periods and identify areas where engagement could be improved.
Identify high-retention products
See which products or features retain users better, allowing you to optimize offerings and strategies for sustained growth.
Benchmark growth
Determine the level of retention needed to achieve desired growth, helping to set realistic goals and targets for your app.
Optimize your investments
Recognize when it’s more cost-effective to focus on retaining existing users rather than investing heavily in acquiring new ones.
Retention analysis in Botsi provides valuable insights into user behavior through a powerful set of filters and groups, enabling you to make informed decisions and refine your strategies over time.
Why Retention Matters
Retention is one of the most important metrics for assessing the long-term success of your app. It provides insights into how well users are engaging with your product over time, which can help you focus on retaining your existing audience instead of constantly seeking new users. A high retention rate often correlates with a more sustainable business model, as it costs less to retain existing users than to acquire new ones.
Retention data is gathered through the SDK and store notifications, and it requires no additional configuration from your side.
Calculation
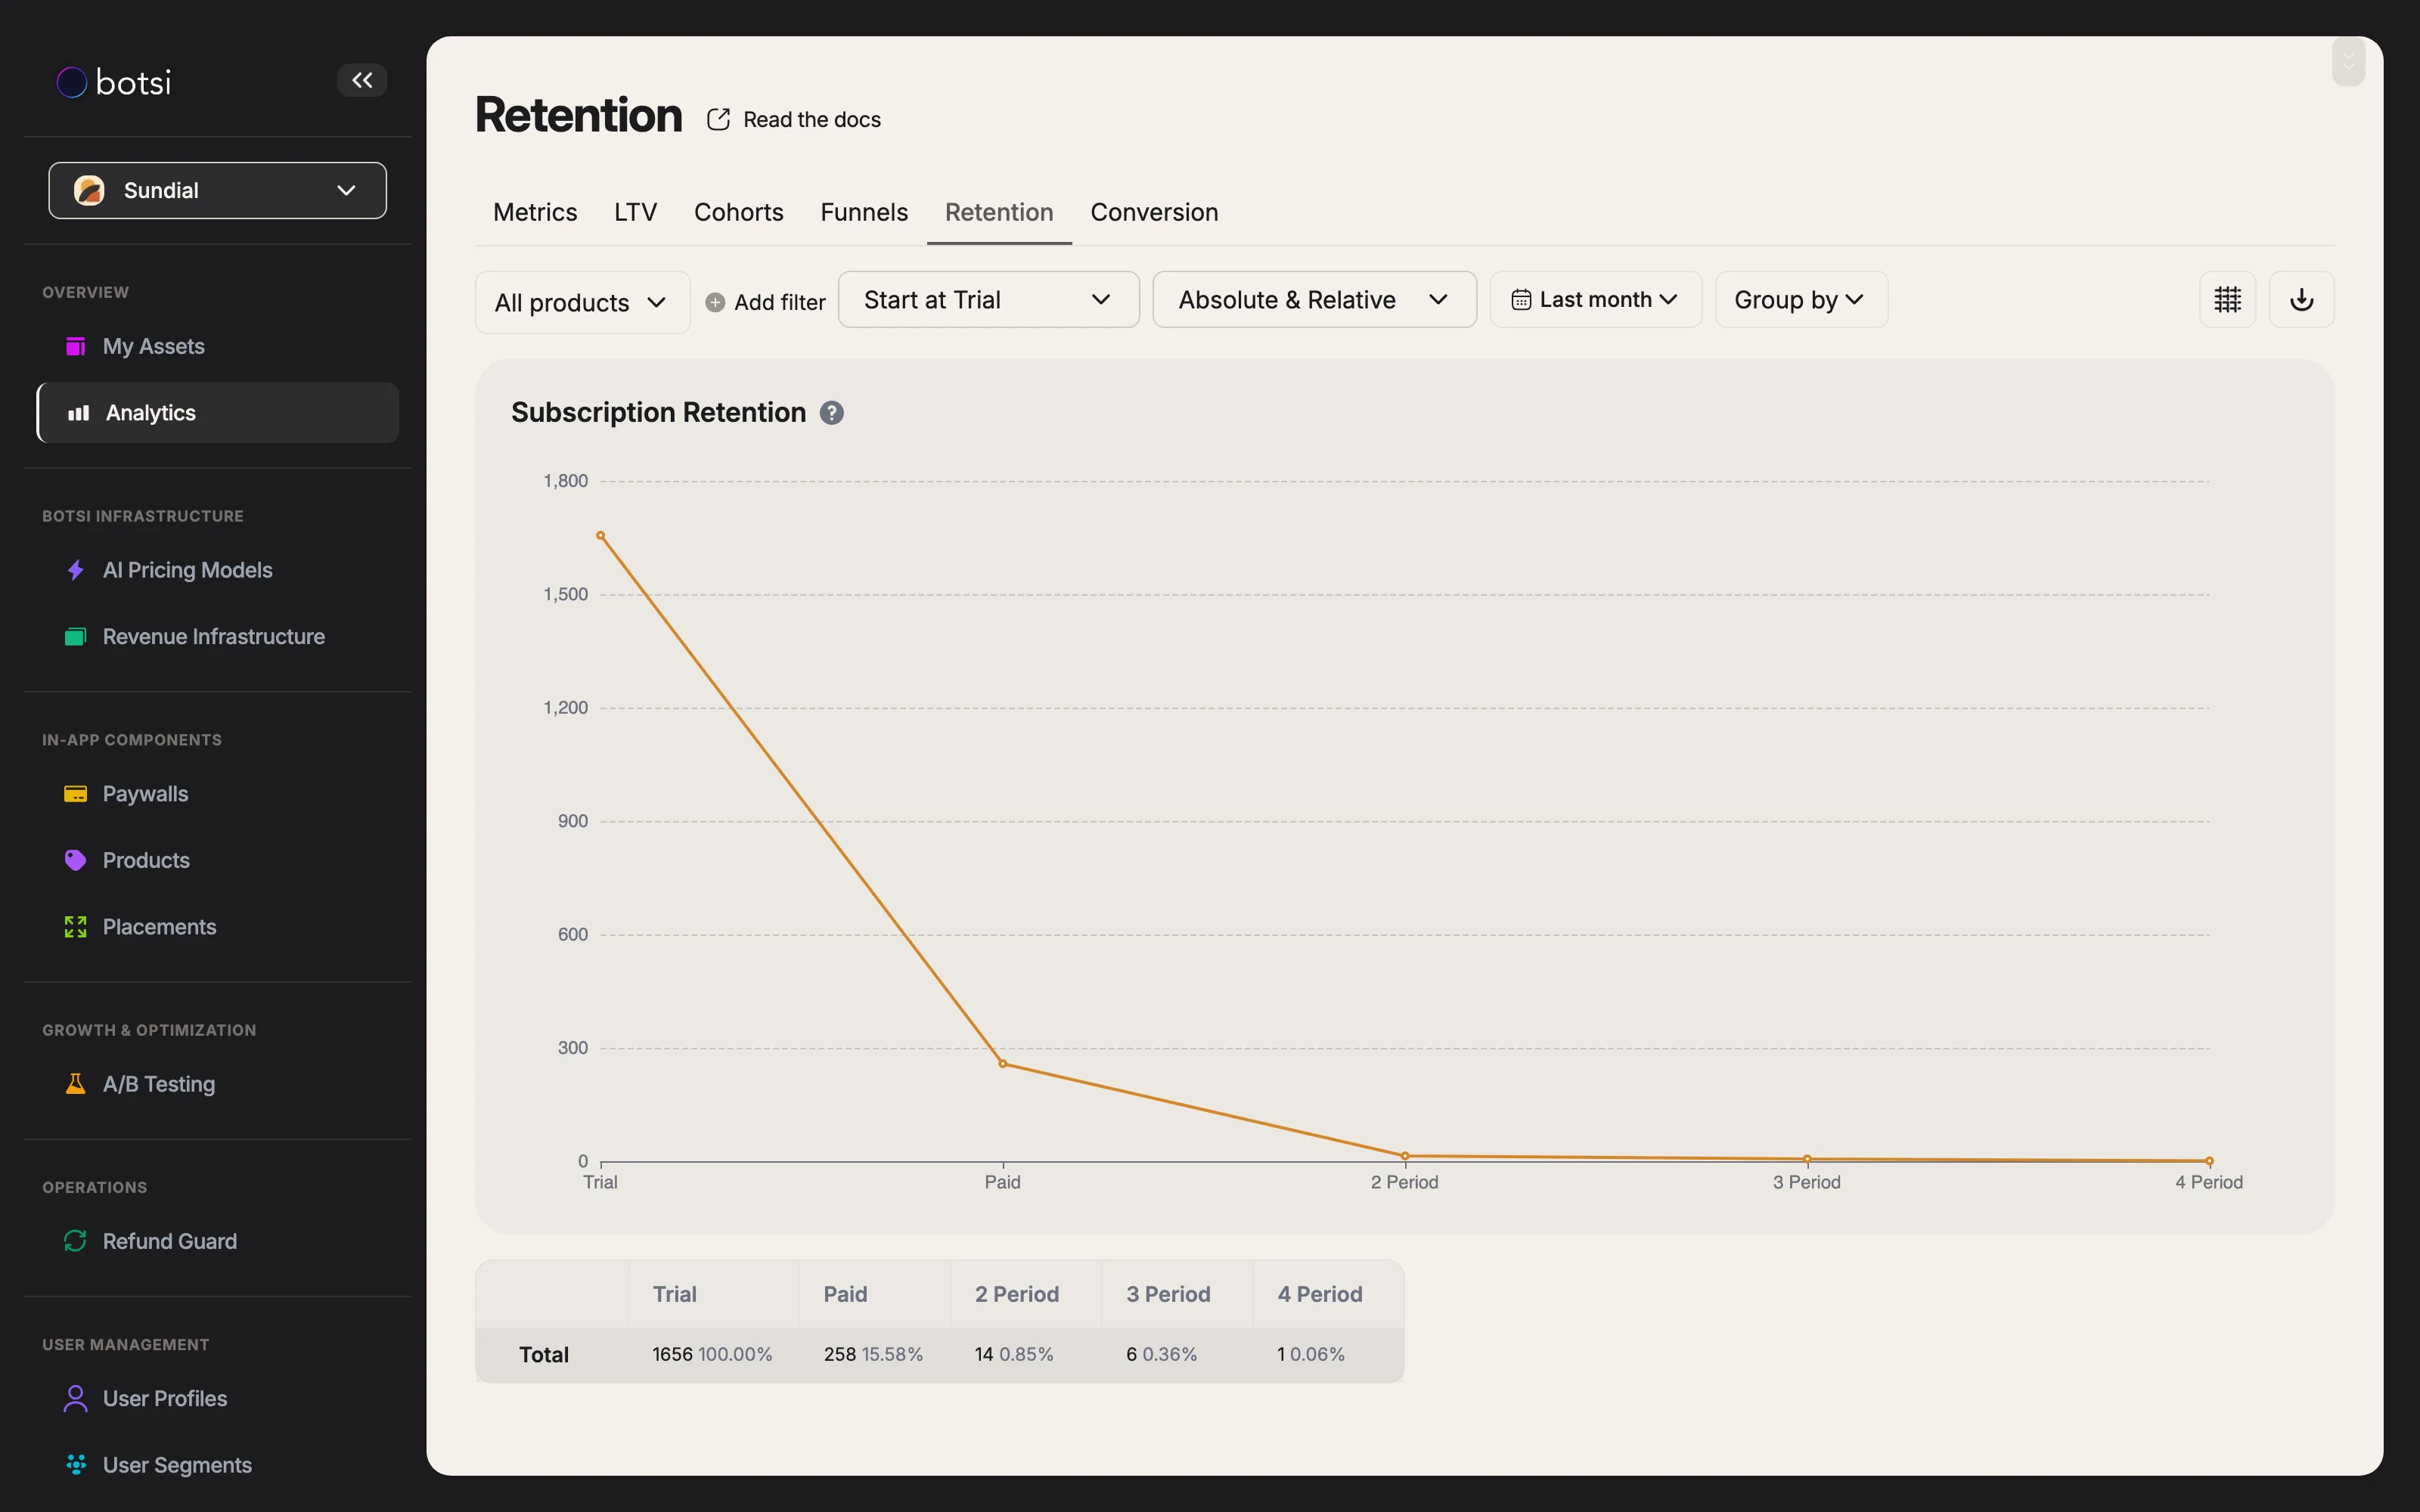
In the retention chart, we track the number of users depending on the step they take: trial (if the "show trials" checkbox is checked), the 1st payment, the 2nd payment, and so on.
For example, if you've selected the last 3 months in the calendar and unchecked "show trials," we count only those who made their first subscription during that period. If "show trials" is checked, we count all users who started a trial in the selected timeframe. For these users, we show the absolute retention at each step (the number of users who made the Nth payment) and the relative retention (the ratio of the Nth payment to the total number of subscriptions or trials within the selected period).
Retention Opportunities
-
Work with the Audience Retention is all about understanding your audience’s preferences and whether your product meets their expectations. Measuring retention is key to building lasting relationships with your customers. It’s generally cheaper to retain customers than to acquire new ones, leading to a higher lifetime value and reduced marketing costs.
-
Work with the Product Retention charts show the actual consumption lifetime of your product and help you forecast long-term success. By improving product delivery, you can increase retention and continue optimizing toward your business goals. This ongoing process is crucial in adapting to changes in user behavior and market conditions.
-
Work with the Market By analyzing retention data from different countries and stores, you can uncover valuable insights about regional preferences and market dynamics. Understanding local trends can help you tailor your strategy and scale your app in specific markets more effectively.
Retention Data Overview
The retention chart shows how the retention level depends on the steps in the user lifecycle. These steps are shown along the horizontal axis: Trial, Paid (1st subscription), P2 (2nd subscription), P3, P4, etc.
- If the "Show Trials" checkbox is selected, the chart starts with the Trial step.
- If it’s unchecked, the chart starts with the Paid step (including both users who started a trial and those who directly paid).
You can hover over any point on the chart to view a pop-up summary of the data for that step.
Curves, Table View, Filters, and CSV Export
The retention chart is complemented by a table that provides numerical data for each step. The table replicates the structure of the chart and includes the following features:
- Grouping and Filters: Group and filter data based on product type, time range, country, and more.
- Absolute and Relative % Control: Choose between absolute numbers or relative percentages to view the data that’s most relevant to your analysis.
The CSV export button allows you to export retention data to a file, which you can open in Excel, Google Sheets, or import into your preferred analytics system for further analysis.